The coronavirus pandemic and ensuing lockdowns, which began taking effect from early March at the global level have resulted in sudden disruption of transport and industrial activity along with almost whole of social and economic life. The lockdowns have been done to contain the spread of the virus as well as gain time for ramping up coping strategies and mechanisms to manage health and economic hazards caused by the pandemic. The large scale curtailment of industrial activity has provided a window to register the effect of vehicular and industrial pollution on urban life. Dip in pollution levels have been reported from every part of the world implementing a lockdown. Some prominent names in the list of cities which have witnessed a drastic decrease in pollution are from China, western Europe and the Indian subcontinent.
To understand the change in the air quality of Delhi, ambient air quality data collected by the Delhi Pollution Control Committee (DPCC) at National Institute of Malaria Research (NIMR). Sector-8, Dwarka Delhi has been analysed. The twenty-four-hour average concentration of six primary air pollutants i.e. PM2.5, PM10, Ozone (O3), Nitrogen Dioxide (NO2), Sulphur Dioxide (SO2) and Carbon Monoxide (CO), as collated by the World Air Quality Project, has been compared for 7 weeks between 18 March and 05 May over three years, 2018, 2019 and 2020.
The analysis reveals a sharp drop in the concentration of five of the six pollutants in 2020 during the lockdown period in India. Other than Ozone all the pollutants exhibited a decline in their concentration as compared to a week before the lockdown. Higher concentrations can be observed in the period between March 18 and March 25 in 2020. These concentrations drop sharply in the period beginning from March 25’ 2020. Particulate Matter pollution declined by one-third in the case of PM 2.5 while in case of PM10 the decline has been fifty percent. Nitrogen Dioxide (NO2) concentration declined about two-thirds in the same period. A major source of this pollutant is vehicular exhaust. Sulphur Dioxide (SO2) emissions declined by thirty percent while the concentration of Carbon Monoxide (CO) emissions remained stable during the period. Ozone (O3) concentration increased in the regular trend but remained significantly below earlier years’ values.
Average PM 2.5 values in 2018 and 2019 were 165 µg/m3 and 150 µg/m3 respectively for the comparison period while the same remained at 109 µg/m3 in 2020. Average value of PM10 concentration declined to 75µg/m3 as compared with 165 µg/m3. PM10 values met National Ambient Air Quality (NAAQ) standards (Central Pollution Control Board, 2009) for thirty-eight of the forty-nine days and were never more than twice the safe limit during the lockdown period (Figure 1 and Figure 2).
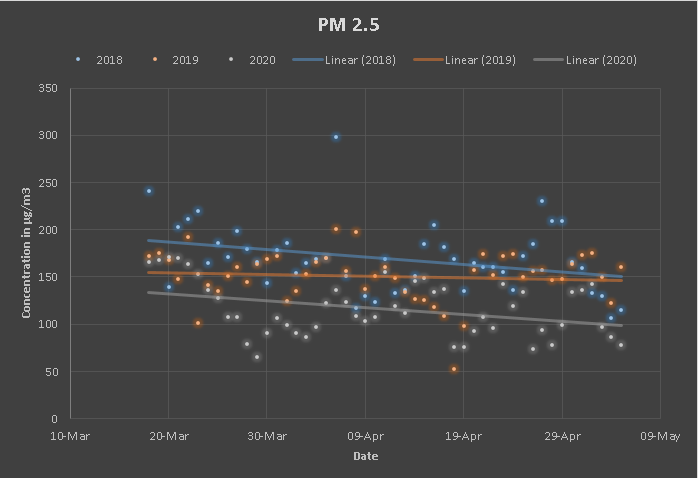
Source: The World Air Quality Project, 2020
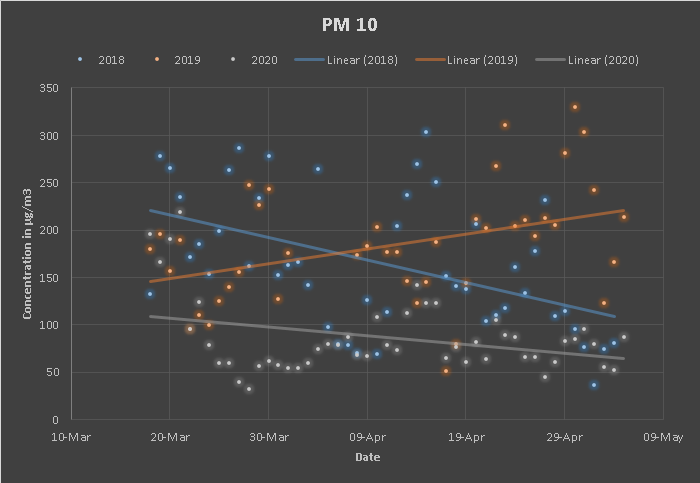
Source: The World Air Quality Project, 2020
The value of Ozone (O3) pollution increased from March 2020 to May 2020 in accordance with the regular trends, as ground-level Ozone concentrations are linked to summer heat. But the decline in Ozone concentration is perceptible as the concentration dropped to an average of 37 µg/m3 compared with 53 µg/m3 and 52 µg/m3 for 2018 and 2019 respectively. These concentrations were always below the safe standard of 100 µg/m3 (Figure 3).
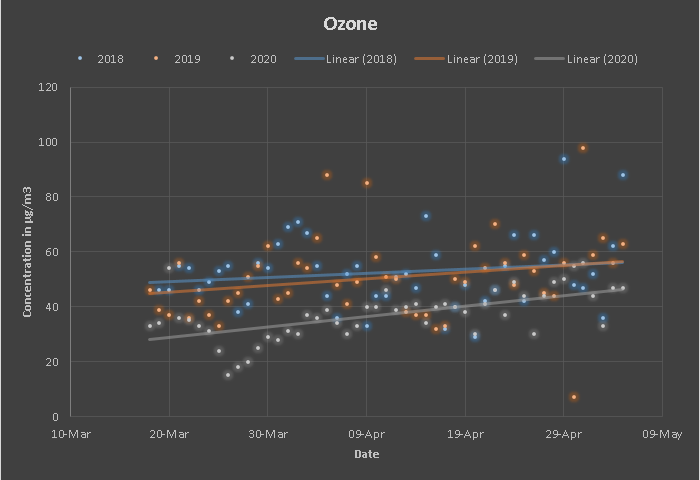
Source: The World Air Quality Project, 2020
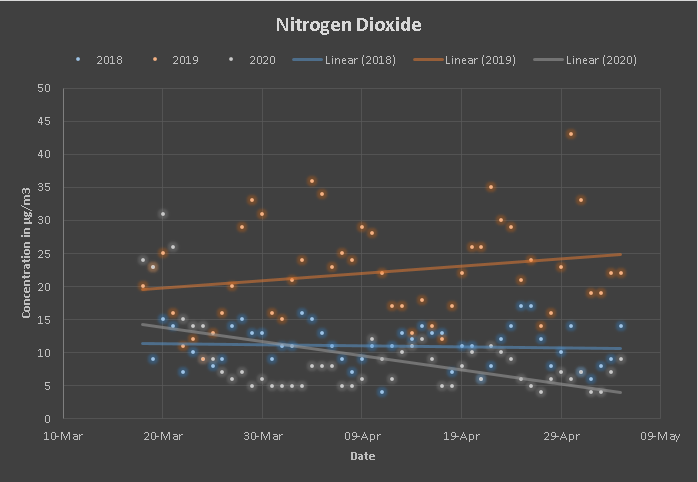
Major human activity leading to the generation of Nitrogen Dioxide (NO2) is the burning of fossil fuels. This includes exhaust from vehicular emissions and industries. Such activity subsided suddenly in the national capital territory of Delhi beginning 25 March 2020. This resulted in a plummeting of Nitrogen Dioxide level as depicted in Figure 4. The Nitrogen Dioxide concentrations declined from a peak of 31 µg/m3 on 20 March 2020 to 9 µg/m3 on 25 March 2020 and reached a bottom of 4 µg/m3 on 27 April 2020. The average concentration during the 7 weeks remained at 7 µg/m3 in 2020 compared to 23 µg/m3 and 11 µg/m3 during the same period in 2019 and 2018 respectively. This represents a sixty-six percent decline compared to the previous year. Only essential transportation and industrial services were maintained during this period.
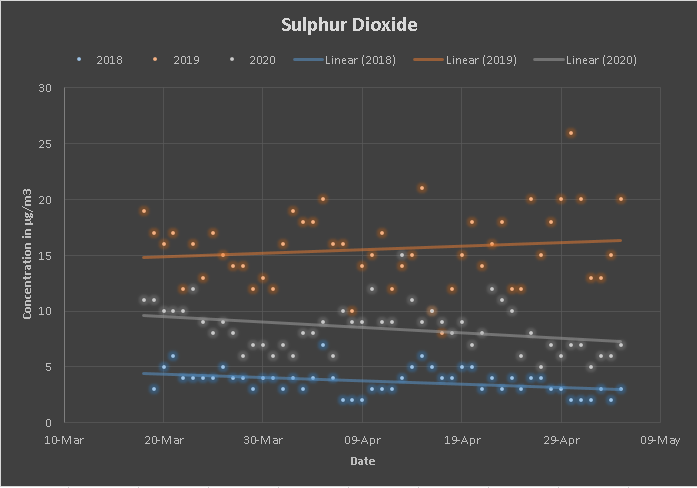
Sulphur Dioxide (SO2) pollution also declined in 2020 compared to 2019 but remained above 2018 pollution levels (Figure 5). Major sources of this pollutant are thermal power plants, trains, diesel-fuelled equipment and sometimes preservatives in fruit and vegetable storages. Average values of concentration remained at 4 µg/m3, 16 µg/m3 and 8 µg/m3 for the year 2018, 2019 and 2020 respectively.
Source: The World Air Quality Project, 2020
Source: The World Air Quality Project, 2020
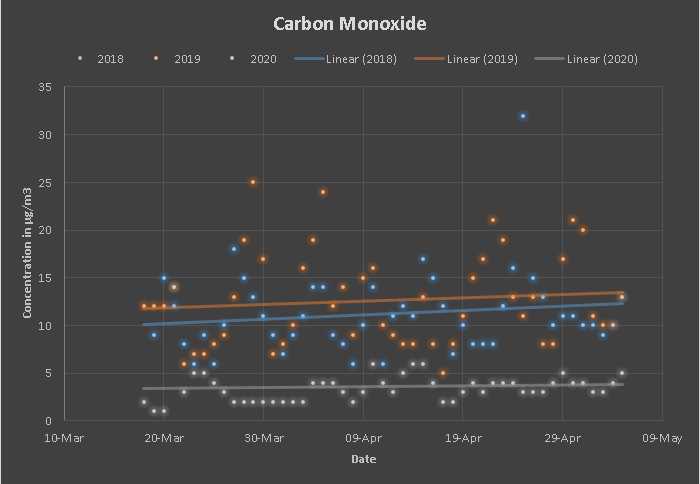
Average value of Carbon Monoxide (CO) concentration declined to 4 µg/m3 compared to 11 µg/m3 in 2018 and 13 µg/m3 in 2019. It is generated by the incomplete combustion of fossil fuels and is part of vehicle emissions. The concentrations of this pollutant have remained consistently low during the entire study period (Figure 6).
Source: The World Air Quality Project, 2020
The decline in pollution levels during the lockdown period has been comprehensive and has proven the role of transport and industrial sector in urban air pollution. Since, the study utilizes data from the residential quarter of the city the primary contributor to the data is vehicular emissions and thus, signify the major role of vehicular exhausts in urban air pollution. This calls for policies and strategies to tackle this pollution source. A shift of transport to public and non-motorised modes shall be the focus for the future bringing about cleaner air in the cities. Industries should also implement schemes to catch and suppress pollution at source.
Detailed data tables for pollutant concentrations at National Institute of Malaria Research, Sector-8 Dwarka, Delhi have been provided in the annexures.
Cover Image by – Vijay Barot | Wikipedia
References
Central Pollution Control Board (2009) National Ambient Air Quality Standards. India: The Gazette of India. Available at: https://cpcb.nic.in/uploads
/National_Ambient_Air_Quality_Standards.pdf. The World Air Quality Project (2020) Delhi Air Pollution Historical Data, aqicn.org. Available at: https://aqicn.org/city/delhi/punjabi-bagh/ (Accessed: 5 May 2020).